 Source
Diagnosing a Rails Performance Issue
At my work at Aptible, we recently came across an interesting performance issue with one of our more frequented controller actions. It became slow enough that our customers and internal users noticed that something was amiss. I want to document how we got into that situation and how we diagnosed and developed a solution for it as I think it’s informative for how to fix things like this in the future. I’ll show what the high-level process looked like, show some tools that allow us to profile Rails applications, and do a little deep dive at the end into what exactly was causing the problem.
The Setup
At Aptible, most of our applications are set up as a single page frontend with a Rails-based API, usually with a Postgres database as the persistent storage (sometimes with a little Redis sprinkled in for caching and worker queues). Our frontends are pretty standard React applications that make requests of the backend for resources, they and manage state via Redux.
Because the application in question was a newer project, we had decided not to implement server-side pagination for a few reasons:
- The datasets we had - even for active customers - was small, and the server performance was pretty good for the most part
- The complexity involved on the frontend of implementing server-side pagination was pretty significant, and we were more concerned with developing features to solve business problems
- The preloaded dataset helped us move faster since it simplified the mental model that frontend engineers had when developing features. They did not have to be concerned about whether the frontend state had all the relevant data.
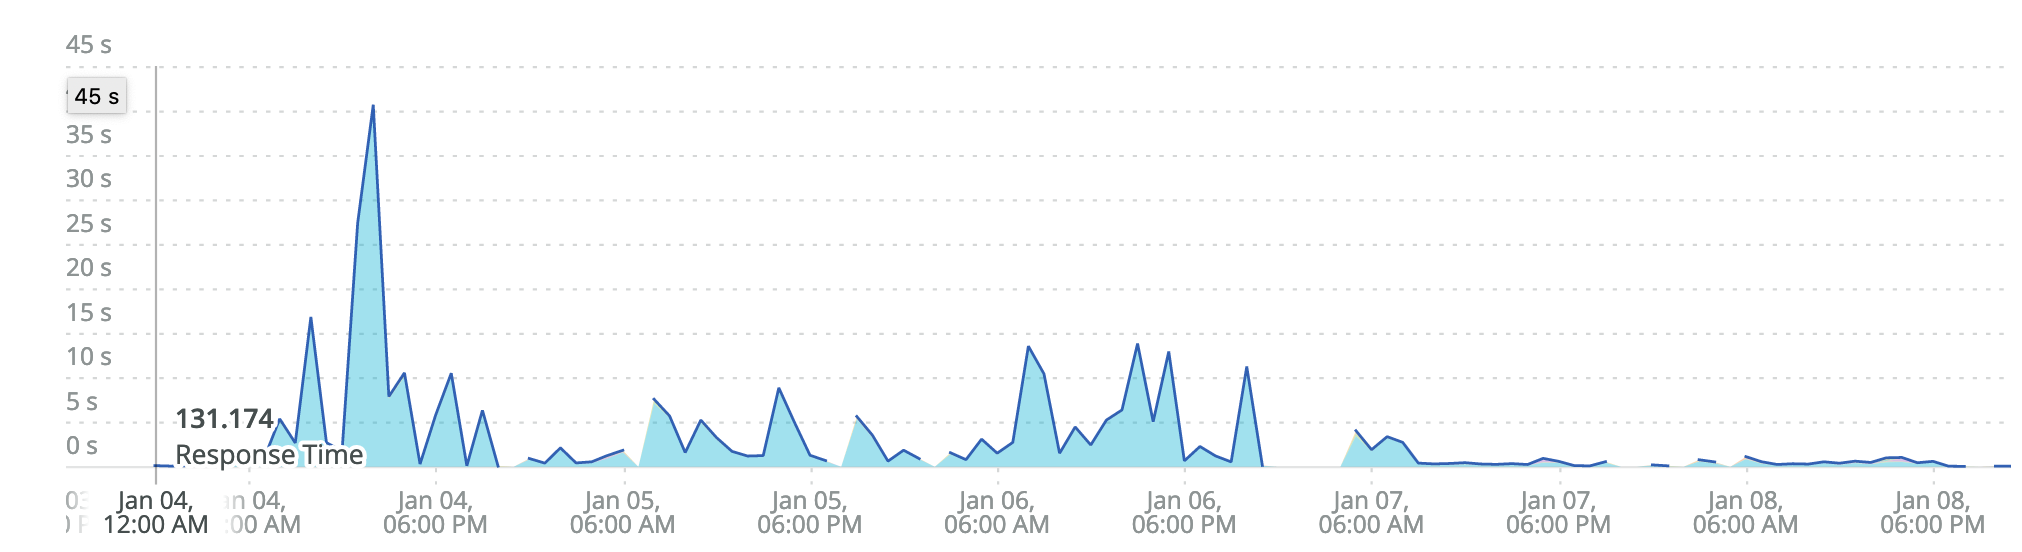
At the beginning of 2021 we started seeing some response times tick up quite a bit and started hearing some complaints from customers. As we dove into the details, some of the more-requested endpoints had response times balloon from 5-6 seconds (which already is not great) to above 60 seconds! Response times were so long we started to see timeouts from Nginx (our outer load-balancing layer).
We quickly determined that we needed to a longer term solution, but the alternatives being discussed would all take weeks to implement; we needed some solutions immediately. So began the foray into diagnosing the performance issue.
The Problem Is…
The first place we look is NewRelic. It was quickly apparent that things were slow:
Generally, with Rails performance issues, the first thing to look at is the SQL queries to see if we’ve introduced an N+1 problem or if any queries look especially slow. Peering at the rollup of the endpoint, we see this data:
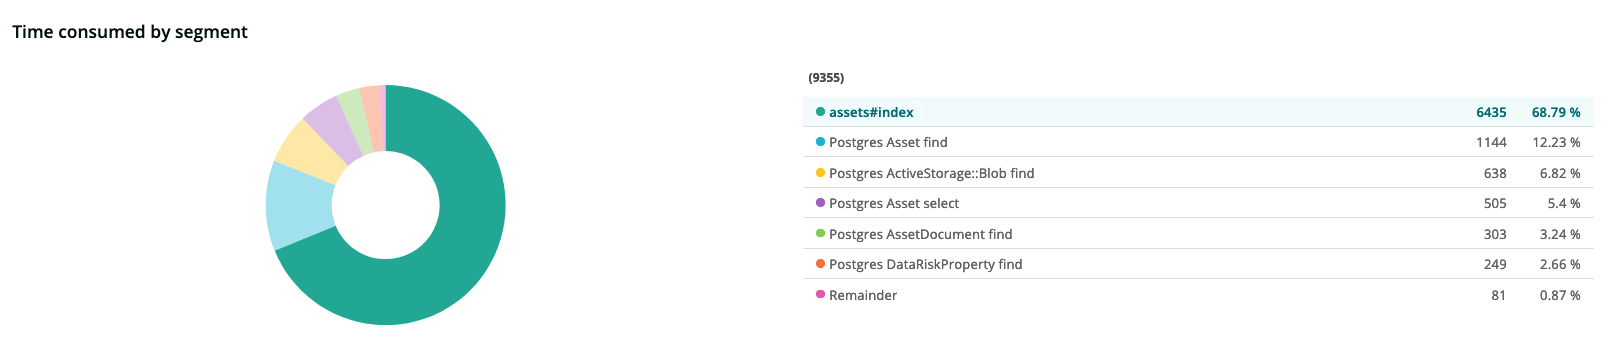
It doesn’t look like the SQL queries are a problem, at least in the aggregate. It looked like most of the time (~60%) is spent in the controller action itself. Immediately, we can start to see that the database might not be the bottleneck.
Let’s take a look at one of the specific action’s trace to see if there is any more data:
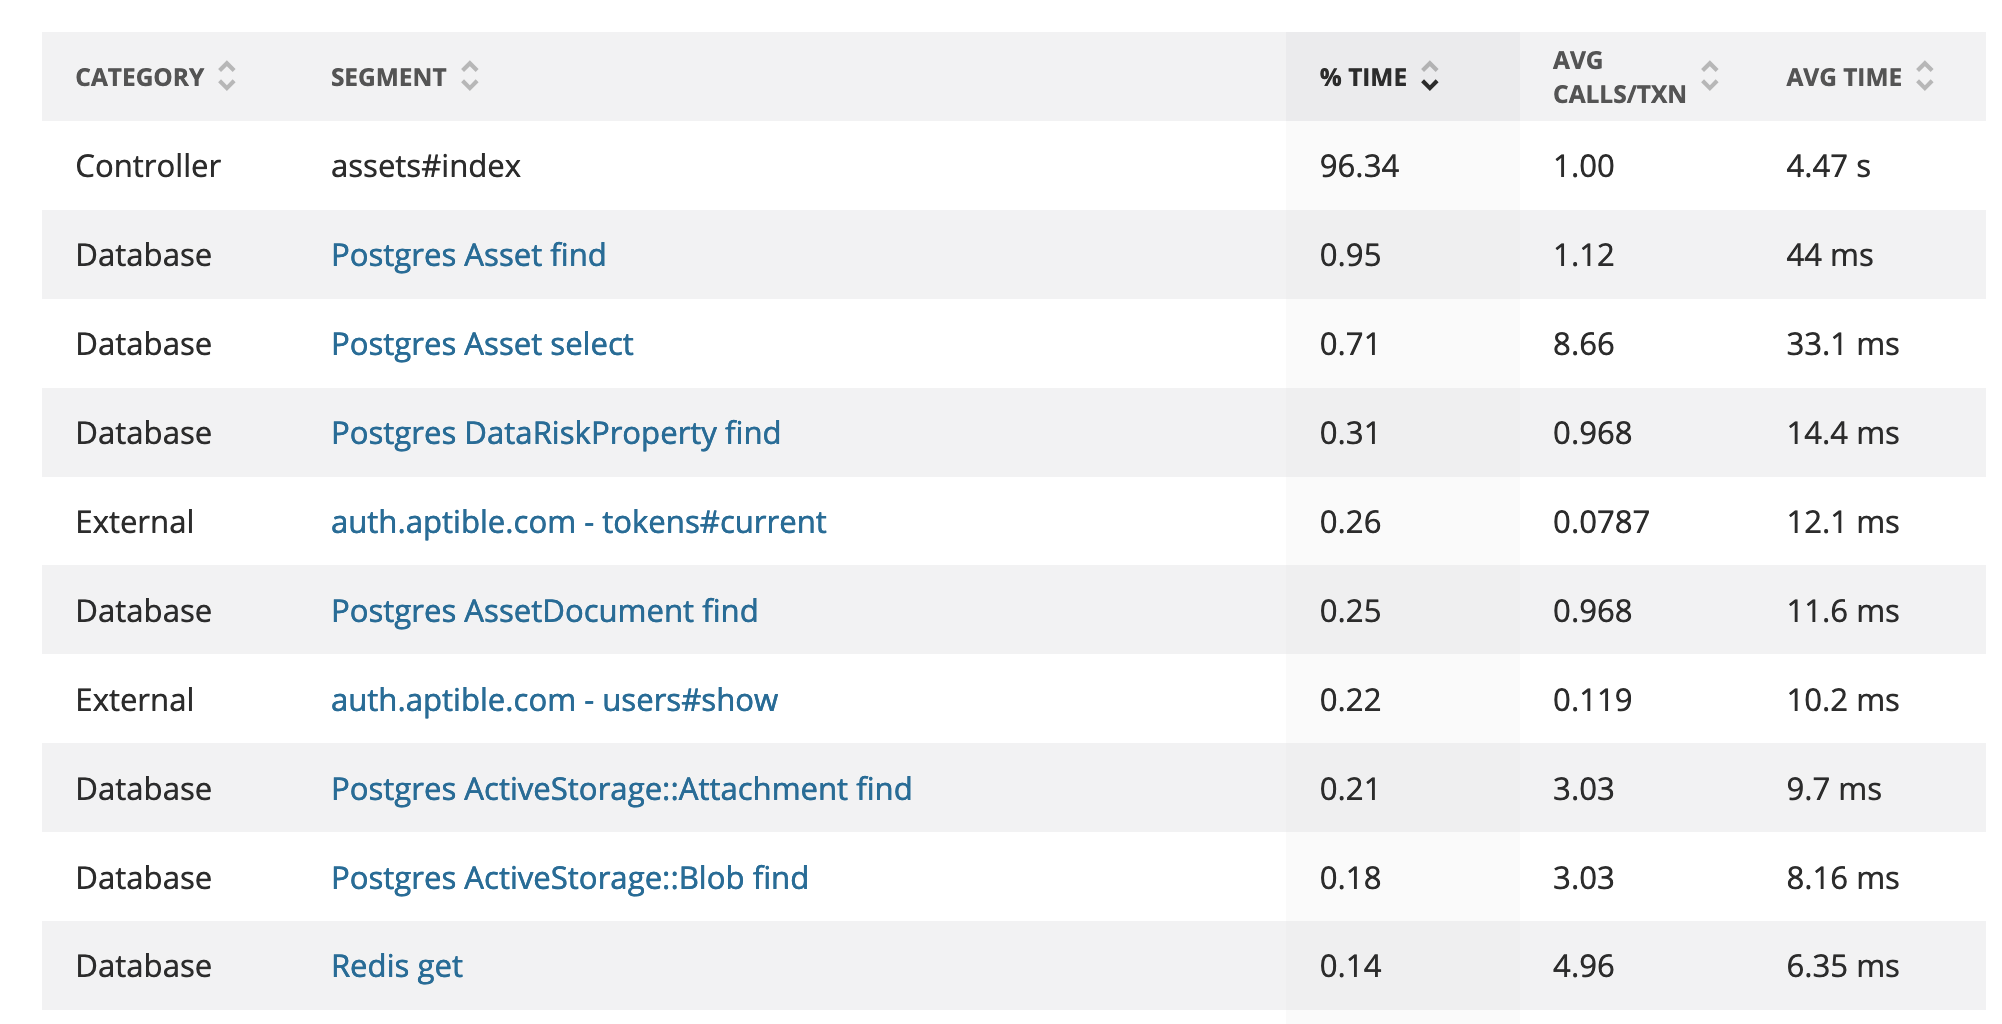
Whoa! We can see from this specific trace that the aggregate rollup was hiding a little bit of data from us; the controller action appears to take over 90% of the time, and the database doesn’t seem to be an issue at all.
And here’s where NewRelic breaks down a bit. NewRelic isn’t a sampling profiler. It is mostly pulling its data from the same system as the Rails logger, so it doesn’t have the detailed data of what method is taking up all that time, just the controller action.
To get that data, we’ll need to hook up a profiler to the running application and get some finer-grained information on what methods the action is calling and how long they are taking to execute.
Finding the Root Cause
Ok, so let’s hook up a profiler!
There are several that Rails works with, but for the purposes, I was looking for, I went with rack-mini-profiler. It’s a sampling call-stack profiler, so it’s going to give a snapshot of the Ruby call stack over a specific time interval. It supports some nice-looking flamegraphs to provide a visual sense of what the application is doing over the lifetime of a request.
Before we start profiling, there are a few things we’ll want to do first. Since we’re experiencing the issue in production, we need to make sure we’re simulating production as closely as possible. From a Rails perspective, that means we’ll want to make sure that things like class caching are enabled and that our application server is in a similar configuration to how it is run in production (e.g., the same number of Puma processes and threads). If we have a caching layer that we use an external data store for (e.g., Memcached or Redis) we’ll want to make sure we’re using that as well.
We’ll also want to make sure our dataset looks similar to what we have in production in terms of size and how the data model looks in terms of each model’s relationships. For example, a serialization issue with a related model might not rear its head if there aren’t enough related models to make a difference.
Note that our Rails application is API only, so we have to do a bit of work to get a proper flamegraph generated using curl. So, after tinkering for a bit, we can run the following:
$ curl 'http://localhost:4007/programs/a7ed7245-50c5-4a99-a5ed-3e103ce23568/assets?pp=flamegraph' > flamegraph.html
which will output the following colorful graph:
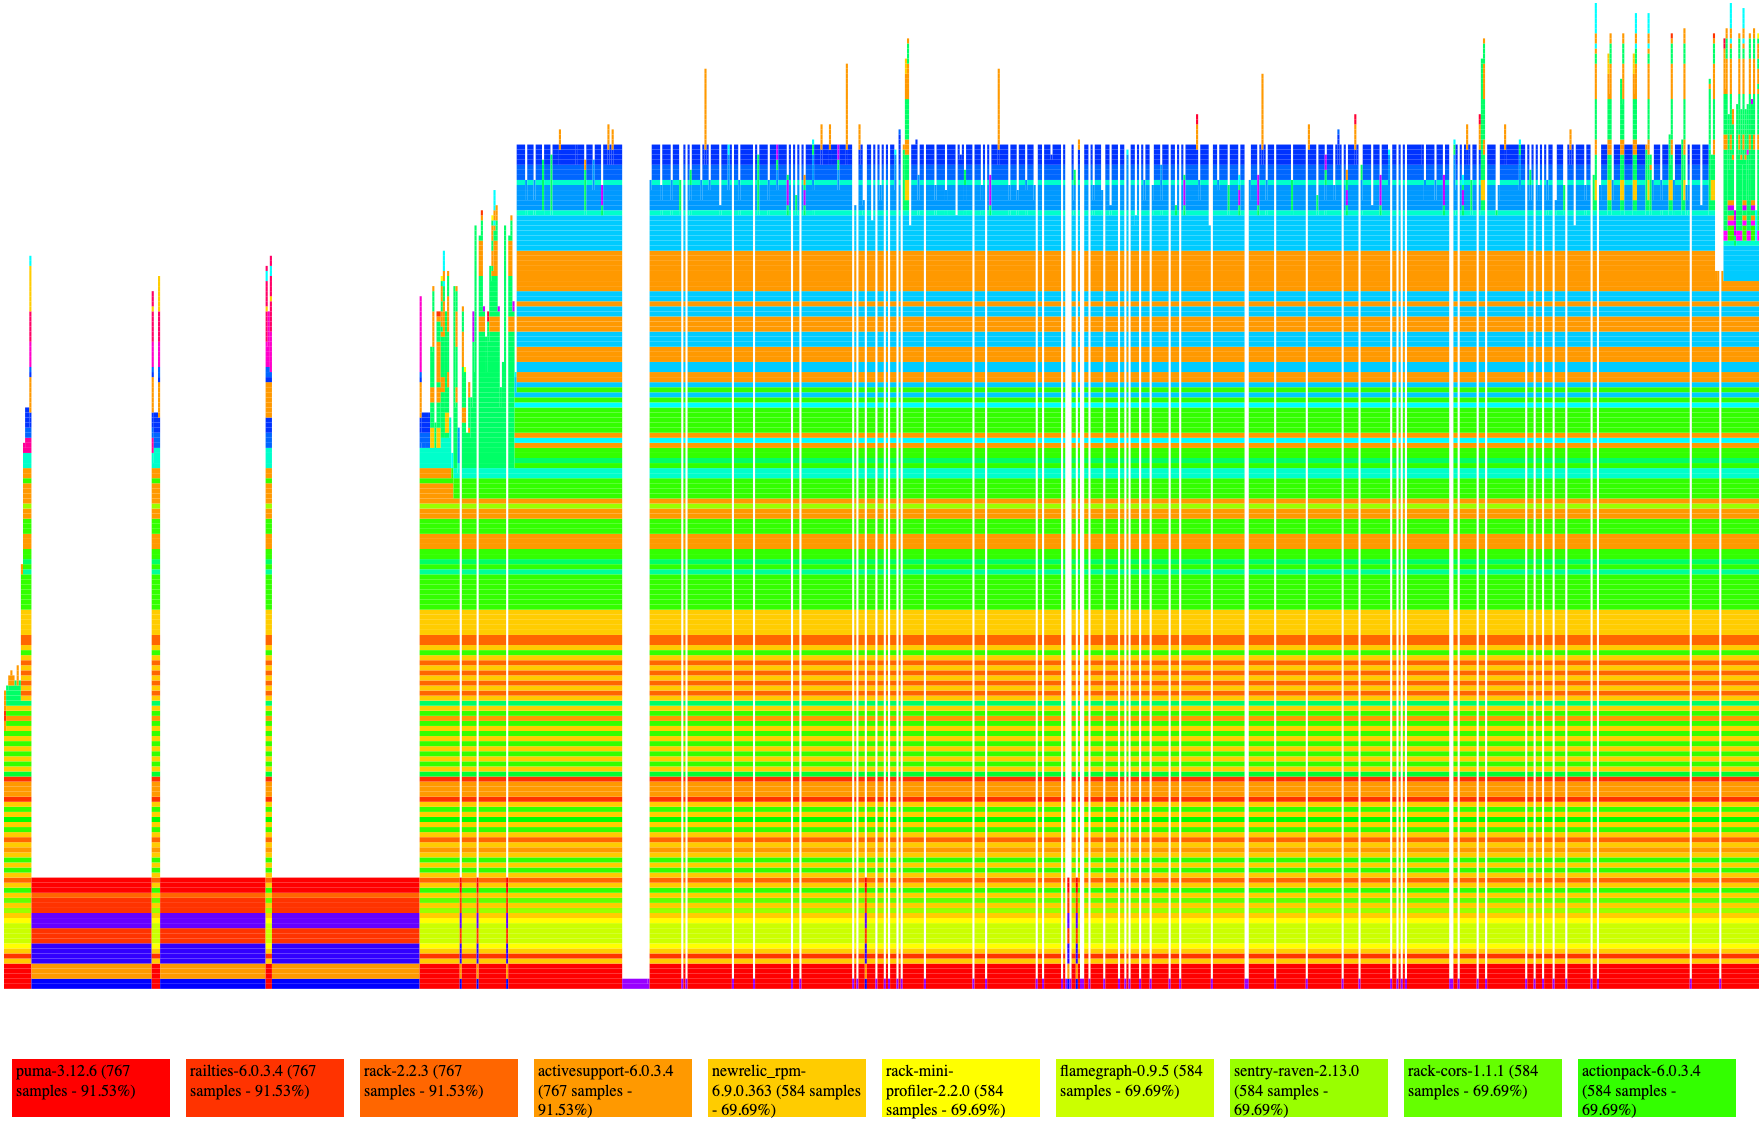
Now, this is a dense set of data. Essentially what is going on is the profiler is taking a snapshot of the Ruby call stack at a specific interval and then representing that via the colored bars. While not pictured here, you can hover over and click on each bar and get an indication of what method the bar represents:
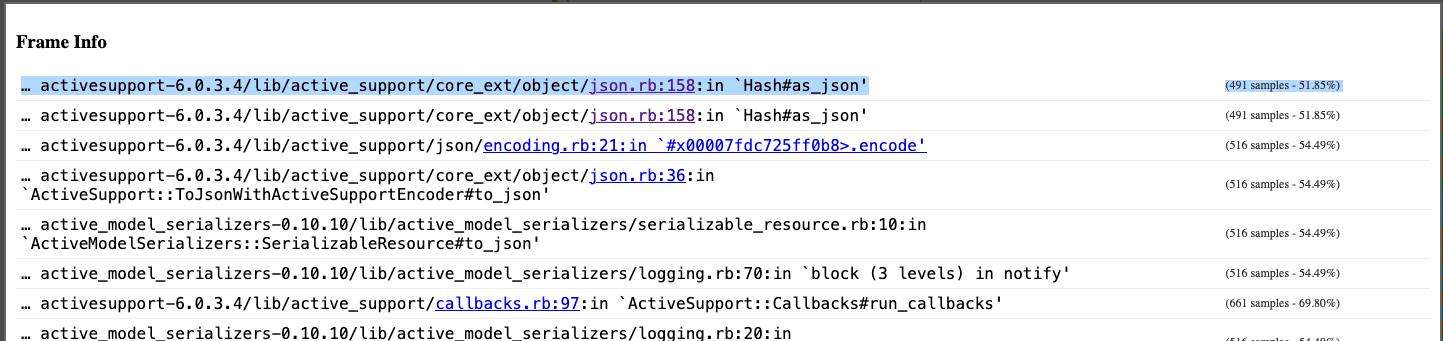
As we look at the graph in aggregate, a sort of pattern emerges. If we look closely, we can see a few methods that appear to be taking up the lion’s share of execution time. Most of these methods are internal methods to either Ruby or Rails, such as Hash#as_json or ActiveModel::Serializer#attributes_hash, so we can safely ignore those methods as there’s likely no way around them. What we’d like to find is code that’s specific to our application that might either:
- Take a long time to execute or;
- Might not take a long time to execute but appears to be being called over and over again.
After staring at the graph, we can see we might be in the second case. We can isolate that there is a specific controller action that takes a long time (the index action) and that it seems to be spending quite a bit of time in serialization. I also want to point out the slight gaps between some method calls; if you trace down to the bottom of the graph, it’s actually when the Ruby garbage collector is running. While we couldn’t be sure as to the exact cause, it’s clear that the GC is running part of the time, and we might want to investigate the memory allocations of this request.
Diving further in, we can also see quite a bit of time spent in the can? method of the cancan gem. We use this gem for authorization. After perusing the serializer code specific to this action, we
see we have two attributes (allowed_to_create and allowed_to_update) that delegate to the can? method to get their values. We were pretty sure that these two attributes were the problem, so to test it out, we removed one of them and tested the endpoint:
# Before
method=GET path=assets
 controller=AssetsController action=index status=200
 duration=2620.48 view=2511.93 db=30.64

# After
method=GET path=/assets format=hal
  controller=AssetsController action=index status=200
  duration=852.01 view=446.80 db=54.75
That was it! It’s safe to assume that we found the issue, and it lies in the call to the can? method.
The Solution (pt. 1)
Now that we’ve isolated the code, we get to go about fixing the issue.
At this point, we took a step back and looked at exactly what this code was doing; as mentioned before, we have two attributes (allowed_to_create and allowed_to_update) on our serializers that were calling the can? method of the CanCan::Ability file to get their values. The root of why this code existed is because of the single-page application architecture. To ensure a good user experience, we wanted only to display “Create” and “Update” actions and buttons on resources that a given user had the authority to edit. The solution was to add an allowed_to_create and allowed_to_update method when the attribute when a specific resource is serialized, matching the currently logged-in users’ authorization to that resource.
But another engineer noted that we didn’t even need the allowed_to_create serialized! We had an entirely separate bit of functionality that now handled that case. Keeping that in mind, were we able to remove the allowed_to_create attribute and halved the response time. Could we remove the additional allowed_to_update
attribute?
Unfortunately, we couldn’t; we still had to ensure that the resource being loaded was allowed to be edited by the current user. After working through the stack trace a bit more, the allowed_to_update method appeared to be slowest when hitting this case defined in the ability.rb file:
can U, Asset do |asset|
  asset.email == @user.email
end
After commenting on either side of the conditional, we found most of the slowdown was coming from the @user.email call. At the same time, we weren’t entirely sure why yet; we had a pretty good feeling that we needed to avoid making that call.
The crux of this logic is allowing the currently logged-in user to edit assets that match their email address. The way CanCan works, this block is evaluated on each individual ActiveRecord model passed to it when can? is called. In this case, that means for every Asset object serialized. In the case of the index action, that could be upwards of a few thousand objects!
CanCan also allows us to define a can block like so:
can :update, Asset, id: array_of_ids
This style allows us to preload the specific objects we want to allow users to update instead of defining the block to be executed lazily. After looking at the production data, we determined that there weren’t very many objects that fell into this category, so the array_of_ids would be small and the query fairly inexpensive to run. We made the following change:
array_of_ids = Asset.where(email: @user.email).ids
can :update, Asset, id: array_of_ids
This change brought our response times down to about one-fifth of the previous response times, enough that we knew we’d have a little breathing room to tackle more performance optimizations.
After we deployed this change, we saw response times drop back to a manageable level! Hooray!
But the nagging issue of why exactly that @user.email call was taking so long existed. While we now knew to be wary of it (or at least wary of calling it over and over), we wanted to know precisely why this problem existed.
The Deep Dive
So we know that the ability.can? combined with lazy block calling @user.email was the problem, and we’ve solved the situation in the short term by looking at the design constraints and simply just excluding that method. I hinted at this earlier, but I have the feeling that something within that method is doing a whole bunch of memory allocations, and that’s causing some pressure on the garbage collector to do some collecting which slows everything down. Are we able to figure out exactly what? How would we do that?
While the flamegraphs above are excellent, they only really show a small part of the story. rack-mini-profiler does allow you to take a snapshot of the memory allocations. While it is suitable for a holistic view, it can be difficult to parse out the specific offender in the noise of all the allocations done in the span of a Rails request. We need to isolate the small bit of suspected code from Rails and get an exact tally of all the allocations.
We could instrument this up using the raw Ruby ObjectSpace tools to determine what’s being allocated, but that would require quite a bit of grunt work matching the given objects and trying to decide which file is doing the allocating.
Thankfully, there’s a great little gem called allocation_stats which does a lot of the heavy lifting for us. After reintroducing the offending code, we wrote the following script:
require 'allocation_stats'

# SNIPPED OUT A BUNCH OF SETUP

stats = AllocationStats.trace do
  ability.can?(:update, asset)
end

puts stats.allocations(alias_paths: true)
          .group_by(:class)
          .sort_by_count
          .to_text
This script will give us a list of all the Ruby object allocations being run with the one ability.can? call, grouped by the Ruby class name (e.g. String, Hash).
Running that code gave us the following output:
                                         class                                            count
-----------------------------------------------------------------------------------------  -----
String                                                                                       861
Array                                                                                        269
Hash                                                                                          69
Pathname                                                                                      28
MatchData                                                                                     22
Regexp                                                                                         8
Proc                                                                                           7
Thread::Backtrace                                                                              4
ActiveModel::Attribute::FromDatabase                                                           4
Enumerator                                                                                     4
Time                                                                                           4
Enumerator::Lazy                                                                               3
Object                                                                                         2
Enumerator::Generator                                                                          2
ActiveSupport::Cache::Entry                                                                    2
Garner::Cache::Identity                                                                        2
Oj::CStack                                                                                     1
ActiveModel::AttributeMethods::ClassMethods::AttributeMethodMatcher::AttributeMethodMatch      1
Enumerator::Yielder                                                                            1
Gem::Version                                                                                   1
That’s an awful log of strings that are allocated for a single call to this method. What exactly is this code doing that it’s allocating all those strings? allocation_stats allows us to add the source filename and line number to those allocations. After adding that, we got the following:
class                                            count
--------------------------------------------------------------------------------------  ----------- -----
<GEM:garner-0.5.3>/lib/garner/strategies/context/key/caller.rb                          String      729
<GEM:cancancan-3.2.1>/lib/cancan/ability/rules.rb                                       Array       94
<GEM:activesupport-6.0.3.4>/lib/active_support/cache.rb                                 Array       55
<GEM:activesupport-6.0.3.4>/lib/active_support/cache.rb                                 String      47
<GEM:garner-0.5.3>/lib/garner/strategies/context/key/caller.rb                          Pathname    28
<GEM:cancancan-3.2.1>/lib/cancan/ability.rb                                             Array       23
Aha! We’ve isolated the bulk of these allocations to a single gem: garner. We use this gem to cache information about the user in Rails application. Let’s take a look at the code that seems to be doing all the allocating:
def self.apply(identity, ruby_context = nil)
  value = nil

  if ruby_context.send(:caller)
    ruby_context.send(:caller).compact.each do |line|
      parts = line.match(/(?<filename>[^:]+)\:(?<lineno>[^:]+)/)
      file = (Pathname.new(parts[:filename]).realpath.to_s rescue nil)
      next if file.nil? || file == ''
      next if file.include?(File.join('lib', 'garner'))

      if (root = Garner.config.caller_root)
        root += File::SEPARATOR unless root[-1] == File::SEPARATOR
        next unless file =~ /^#{root}/
        value = "#{file.gsub(root || '', '')}:#{parts[:lineno]}"
      else
        value = "#{file}:#{parts[:lineno]}"
      end

      break
    end
  end

  value ? identity.key(field => value) : super
end
We’re onto something here. As we can see in the gem’s documentation here, it looks like this is part of its cache key resolution process.
The code is reasonably dense but what it is doing is figuring out what file the cache call is defined in by iterating through the output of the Ruby internal caller method. We can see that it’s both calling to_s and using string interpolation (which also allocates a new String object).
We’ve discovered the culprit! While we’ve already fixed our application code, having a resolution on where the original problem was coming from informs our use of the @user.email method going forward. We’re well aware of the method’s caveats: it allocates quite a few strings, so we know not to call it in any code that will have it in a hot loop.
The Followup
I’m so glad you stayed for the journey. Diagnosing performance issues in Rails is made so much easier with the plethora of tools developed by other engineers. I’d encourage you to read the following blogs/blog posts on diagnosing memory usage and performance problems in Rails:
- https://samsaffron.com/archive/2018/06/01/an-analysis-of-memory-bloat-in-active-record-5-2
- https://www.speedshop.co/blog/
- https://www.schneems.com/2020/03/17/lies-damned-lies-and-averages-perc50-perc95-explained-for-programmers/
I’d also be remiss in not mentioning several other excellent Ruby tools to help to profile and diagnose performance problems:
In my next blog post, I will examine the garner gem in-depth to see if we can improve that apply method and see if we can optimize it and, potentially, contribute back a patch for others to use.
